| ||||||||||||||
| Decatur County, Tennessee | ||
 Decatur County Courthouse in Decaturville
| ||
| ||
Location in the state of Tennessee | ||
 Tennessee's location in the U.S. | ||
| Founded | November 1845 | |
|---|---|---|
| Named for | Stephen Decatur[1] | |
| Seat | Decaturville | |
| Largest city | Parsons | |
| Area - Total - Land - Water |
345 sq mi (894 km²) 334 sq mi (865 km²) 11 sq mi (28 km²), 3.2% | |
| Population - (2020) - Density |
11,435 35/sq mi (14/km²) | |
| Congressional district | 7th | |
| Time zone | Central: UTC-6/-5 | |
| Website | decaturcountytn.org | |
Decatur County is a county located in the U.S. state of Tennessee. As of the 2020 census, the population was 11,435.[2] Its county seat is Decaturville.[3]
History[]
This county is named after naval hero Stephen Decatur, Jr., who gained national recognition in the First Barbary War, the Second Barbary War, and the War of 1812 by his leadership and achievements at sea. The county was created in November 1845 from the part of Perry County west of the Tennessee River in response to a petition by citizens on the west side of the river who lacked easy access to the county seat on the east side.[1]
In 2015, the Decatur County clerk of court and the entire staff of that office resigned, to express conscientious objection to the United States Supreme Court's ruling in Obergefell v. Hodges, which would oblige the office to issue marriage licenses to same-sex couples.[4]
Geography[]
According to the U.S. Census Bureau, the county has a total area of 345 square miles (890 km2), of which 334 square miles (870 km2) is land and 11 square miles (28 km2) (3.2%) is water.[5]
Adjacent counties[]
- Benton County (north)
- Perry County (east)
- Wayne County (southeast)
- Hardin County (south)
- Henderson County (west)
- Carroll County (northwest)
National protected area[]
- Tennessee National Wildlife Refuge (part)
State protected area[]
- Carroll Cabin Barrens State Natural Area
- Cypress Pond Refuge
Demographics[]
| Historical populations | |||
|---|---|---|---|
| Census | Pop. | %± | |
| 1850 | 6,003 | ||
| 1860 | 6,276 | 4.5% | |
| 1870 | 7,772 | 23.8% | |
| 1880 | 8,498 | 9.3% | |
| 1890 | 8,995 | 5.8% | |
| 1900 | 10,439 | 16.1% | |
| 1910 | 10,093 | −3.3% | |
| 1920 | 10,198 | 1.0% | |
| 1930 | 10,106 | −0.9% | |
| 1940 | 10,261 | 1.5% | |
| 1950 | 9,442 | −8.0% | |
| 1960 | 8,324 | −11.8% | |
| 1970 | 9,457 | 13.6% | |
| 1980 | 10,857 | 14.8% | |
| 1990 | 10,472 | −3.5% | |
| 2000 | 11,731 | 12.0% | |
| 2010 | 11,757 | 0.2% | |
| U.S. Decennial Census[6] 1790-1960[7] 1900-1990[8] 1990-2000[9] 2010-2020[2] | |||
 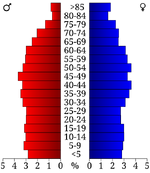 Age pyramid Decatur County[10] |
2020 census[]
| Race | Num. | Perc. |
|---|---|---|
| White (non-Hispanic) | 10,462 | 91.49% |
| Black or African American (non-Hispanic) | 270 | 2.36% |
| Native American | 9 | 0.08% |
| Asian | 42 | 0.37% |
| Pacific Islander | 5 | 0.04% |
| Other/Mixed | 289 | 2.53% |
| Hispanic or Latino | 358 | 3.13% |
As of the 2020 United States census, there were 11,435 people, 4,440 households, and 3,059 families residing in the county.
2000 census[]
As of the census[12] of 2000, there were 11,731 people, 4,908 households, and 3,415 families residing in the county. The population density was 35 people per square mile (14/km2).
There were 6,448 housing units at an average density of 19 per square mile (7/km2). The racial makeup of the county was 94.12% White, 3.47% Black or African American, 0.23% Native American, 0.20% Asian, 0.03% Pacific Islander, 1.20% from other races, and 0.76% from two or more races. 1.95% of the population were Hispanic or Latino of any race.
There were 4,908 households, out of which 27.30% had children under the age of 18 living with them, 56.70% were married couples living together, 9.00% had a female householder with no husband present, and 30.40% were non-families. 27.60% of all households were made up of individuals, and 13.40% had someone living alone who was 65 years of age or older. The average household size was 2.34 and the average family size was 2.82.
In the county, the population was spread out, with 21.70% under the age of 18, 7.90% from 18 to 24, 25.90% from 25 to 44, 26.30% from 45 to 64, and 18.20% who were 65 years of age or older. The median age was 41 years. For every 100 females there were 94.50 males. For every 100 females age 18 and over, there were 91.90 males.
The median income for a household in the county was $28,741, and the median income for a family was $34,919. Males had a median income of $25,945 versus $20,155 for females. The per capita income for the county was $17,285. About 13.80% of families and 16.00% of the population were below the poverty line, including 18.90% of those under age 18 and 22.20% of those age 65 or over.
Communities[]
City[]
- Parsons
Towns[]
- Decaturville (county seat)
- Scotts Hill (partial)
Unincorporated communities[]
- Bath Springs
- Bible Hill
- Dunbar
- Holladay (partial)
- Hopewell
- Lick Skillet
- Perryville
- Sugar Tree
Politics[]
Decatur County – like all of rural Tennessee – is a Republican stronghold. The last Democrat to carry this county was Al Gore in 2000, and even before the collapse of traditional rural Democratic support after Bill Clinton the county had a sizeable Unionist population that caused it to vote Republican several times during the “System of 1896”.
| Year | Republican | Democratic | Third party | |||
|---|---|---|---|---|---|---|
| No. | % | No. | % | No. | % | |
| 2020 | 4,229 | 80.69% | 904 | 17.25% | 108 | 2.06% |
| 2016 | 3,588 | 78.14% | 894 | 19.47% | 110 | 2.40% |
| 2012 | 2,874 | 67.61% | 1,303 | 30.65% | 74 | 1.74% |
| 2008 | 3,101 | 65.11% | 1,566 | 32.88% | 96 | 2.02% |
| 2004 | 2,566 | 52.59% | 2,268 | 46.48% | 45 | 0.92% |
| 2000 | 2,046 | 46.82% | 2,278 | 52.13% | 46 | 1.05% |
| 1996 | 1,712 | 40.53% | 2,262 | 53.55% | 250 | 5.92% |
| 1992 | 1,667 | 35.76% | 2,633 | 56.49% | 361 | 7.75% |
| 1988 | 2,286 | 54.55% | 1,880 | 44.86% | 25 | 0.60% |
| 1984 | 2,390 | 53.82% | 2,031 | 45.73% | 20 | 0.45% |
| 1980 | 2,095 | 48.95% | 2,139 | 49.98% | 46 | 1.07% |
| 1976 | 1,637 | 39.77% | 2,432 | 59.09% | 47 | 1.14% |
| 1972 | 2,368 | 64.79% | 1,187 | 32.48% | 100 | 2.74% |
| 1968 | 1,409 | 36.79% | 877 | 22.90% | 1,544 | 40.31% |
| 1964 | 1,429 | 44.08% | 1,813 | 55.92% | 0 | 0.00% |
| 1960 | 1,684 | 54.76% | 1,321 | 42.96% | 70 | 2.28% |
| 1956 | 1,512 | 48.76% | 1,554 | 50.11% | 35 | 1.13% |
| 1952 | 1,406 | 45.35% | 1,681 | 54.23% | 13 | 0.42% |
| 1948 | 1,291 | 42.75% | 1,565 | 51.82% | 164 | 5.43% |
| 1944 | 1,235 | 44.70% | 1,515 | 54.83% | 13 | 0.47% |
| 1940 | 1,275 | 40.90% | 1,832 | 58.77% | 10 | 0.32% |
| 1936 | 919 | 37.96% | 1,502 | 62.04% | 0 | 0.00% |
| 1932 | 601 | 36.58% | 1,020 | 62.08% | 22 | 1.34% |
| 1928 | 748 | 48.04% | 809 | 51.96% | 0 | 0.00% |
| 1924 | 799 | 47.11% | 877 | 51.71% | 20 | 1.18% |
| 1920 | 1,608 | 57.84% | 1,149 | 41.33% | 23 | 0.83% |
| 1916 | 893 | 49.69% | 887 | 49.36% | 17 | 0.95% |
| 1912 | 405 | 24.27% | 758 | 45.42% | 506 | 30.32% |
| 1908 | 958 | 53.13% | 845 | 46.87% | 0 | 0.00% |
| 1904 | 921 | 51.71% | 858 | 48.18% | 2 | 0.11% |
| 1900 | 890 | 49.47% | 909 | 50.53% | 0 | 0.00% |
| 1896 | 890 | 47.11% | 997 | 52.78% | 2 | 0.11% |
| 1892 | 667 | 41.38% | 860 | 53.35% | 85 | 5.27% |
| 1888 | 757 | 46.67% | 862 | 53.14% | 3 | 0.18% |
| 1884 | 653 | 46.28% | 734 | 52.02% | 24 | 1.70% |
| 1880 | 413 | 32.86% | 753 | 59.90% | 91 | 7.24% |
See also[]
- National Register of Historic Places listings in Decatur County, Tennessee
References[]
- ^ a b Teresa Biddle-Douglass, "Decatur County," Tennessee Encyclopedia of History and Culture. Retrieved: 26 June 2013.
- ^ a b "State & County QuickFacts". United States Census Bureau. http://quickfacts.census.gov/qfd/states/47/47039.html.
- ^ "Find a County". National Association of Counties. http://www.naco.org/Counties/Pages/FindACounty.aspx.
- ^ Boggioni, Tom (2015-07-05). "Entire staff in Tenn. county clerk’s office resigns over same-sex marriage". Alternet. http://www.alternet.org/entire-staff-tenn-county-clerks-office-resigns-over-same-sex-marriage.
- ^ "2010 Census Gazetteer Files". United States Census Bureau. August 22, 2012. http://www2.census.gov/geo/docs/maps-data/data/gazetteer/counties_list_47.txt.
- ^ "U.S. Decennial Census". United States Census Bureau. https://www.census.gov/programs-surveys/decennial-census.html.
- ^ "Historical Census Browser". University of Virginia Library. http://mapserver.lib.virginia.edu.
- ^ Forstall, Richard L., ed (March 27, 1995). "Population of Counties by Decennial Census: 1900 to 1990". United States Census Bureau. https://www.census.gov/population/cencounts/tn190090.txt.
- ^ "Census 2000 PHC-T-4. Ranking Tables for Counties: 1990 and 2000". United States Census Bureau. April 2, 2001. https://www.census.gov/population/www/cen2000/briefs/phc-t4/tables/tab02.pdf.
- ^ Based on 2000 census data
- ^ "Explore Census Data". https://data.census.gov/cedsci/table?g=0500000US47039&tid=DECENNIALPL2020.P2.
- ^ "U.S. Census website". United States Census Bureau. https://www.census.gov.
- ^ Leip, David. "Dave Leip's Atlas of U.S. Presidential Elections". http://uselectionatlas.org/RESULTS.
External links[]
- Official site
- Decatur County Chamber of Commerce
- Decatur County Schools
- Decatur County, TNGenWeb – genealogy resources
- Decatur County at Curlie

|
Carroll County | Benton County |
| |
| Henderson County | Perry County | |||
 Decatur County, Tennessee | ||||
| Hardin County | Wayne County |
Template:Decatur County, Tennessee
|
| This page uses content from the English language Wikipedia. The original content was at Decatur County, Tennessee. The list of authors can be seen in the page history. As with this Familypedia wiki, the content of Wikipedia is available under the Creative Commons License. |