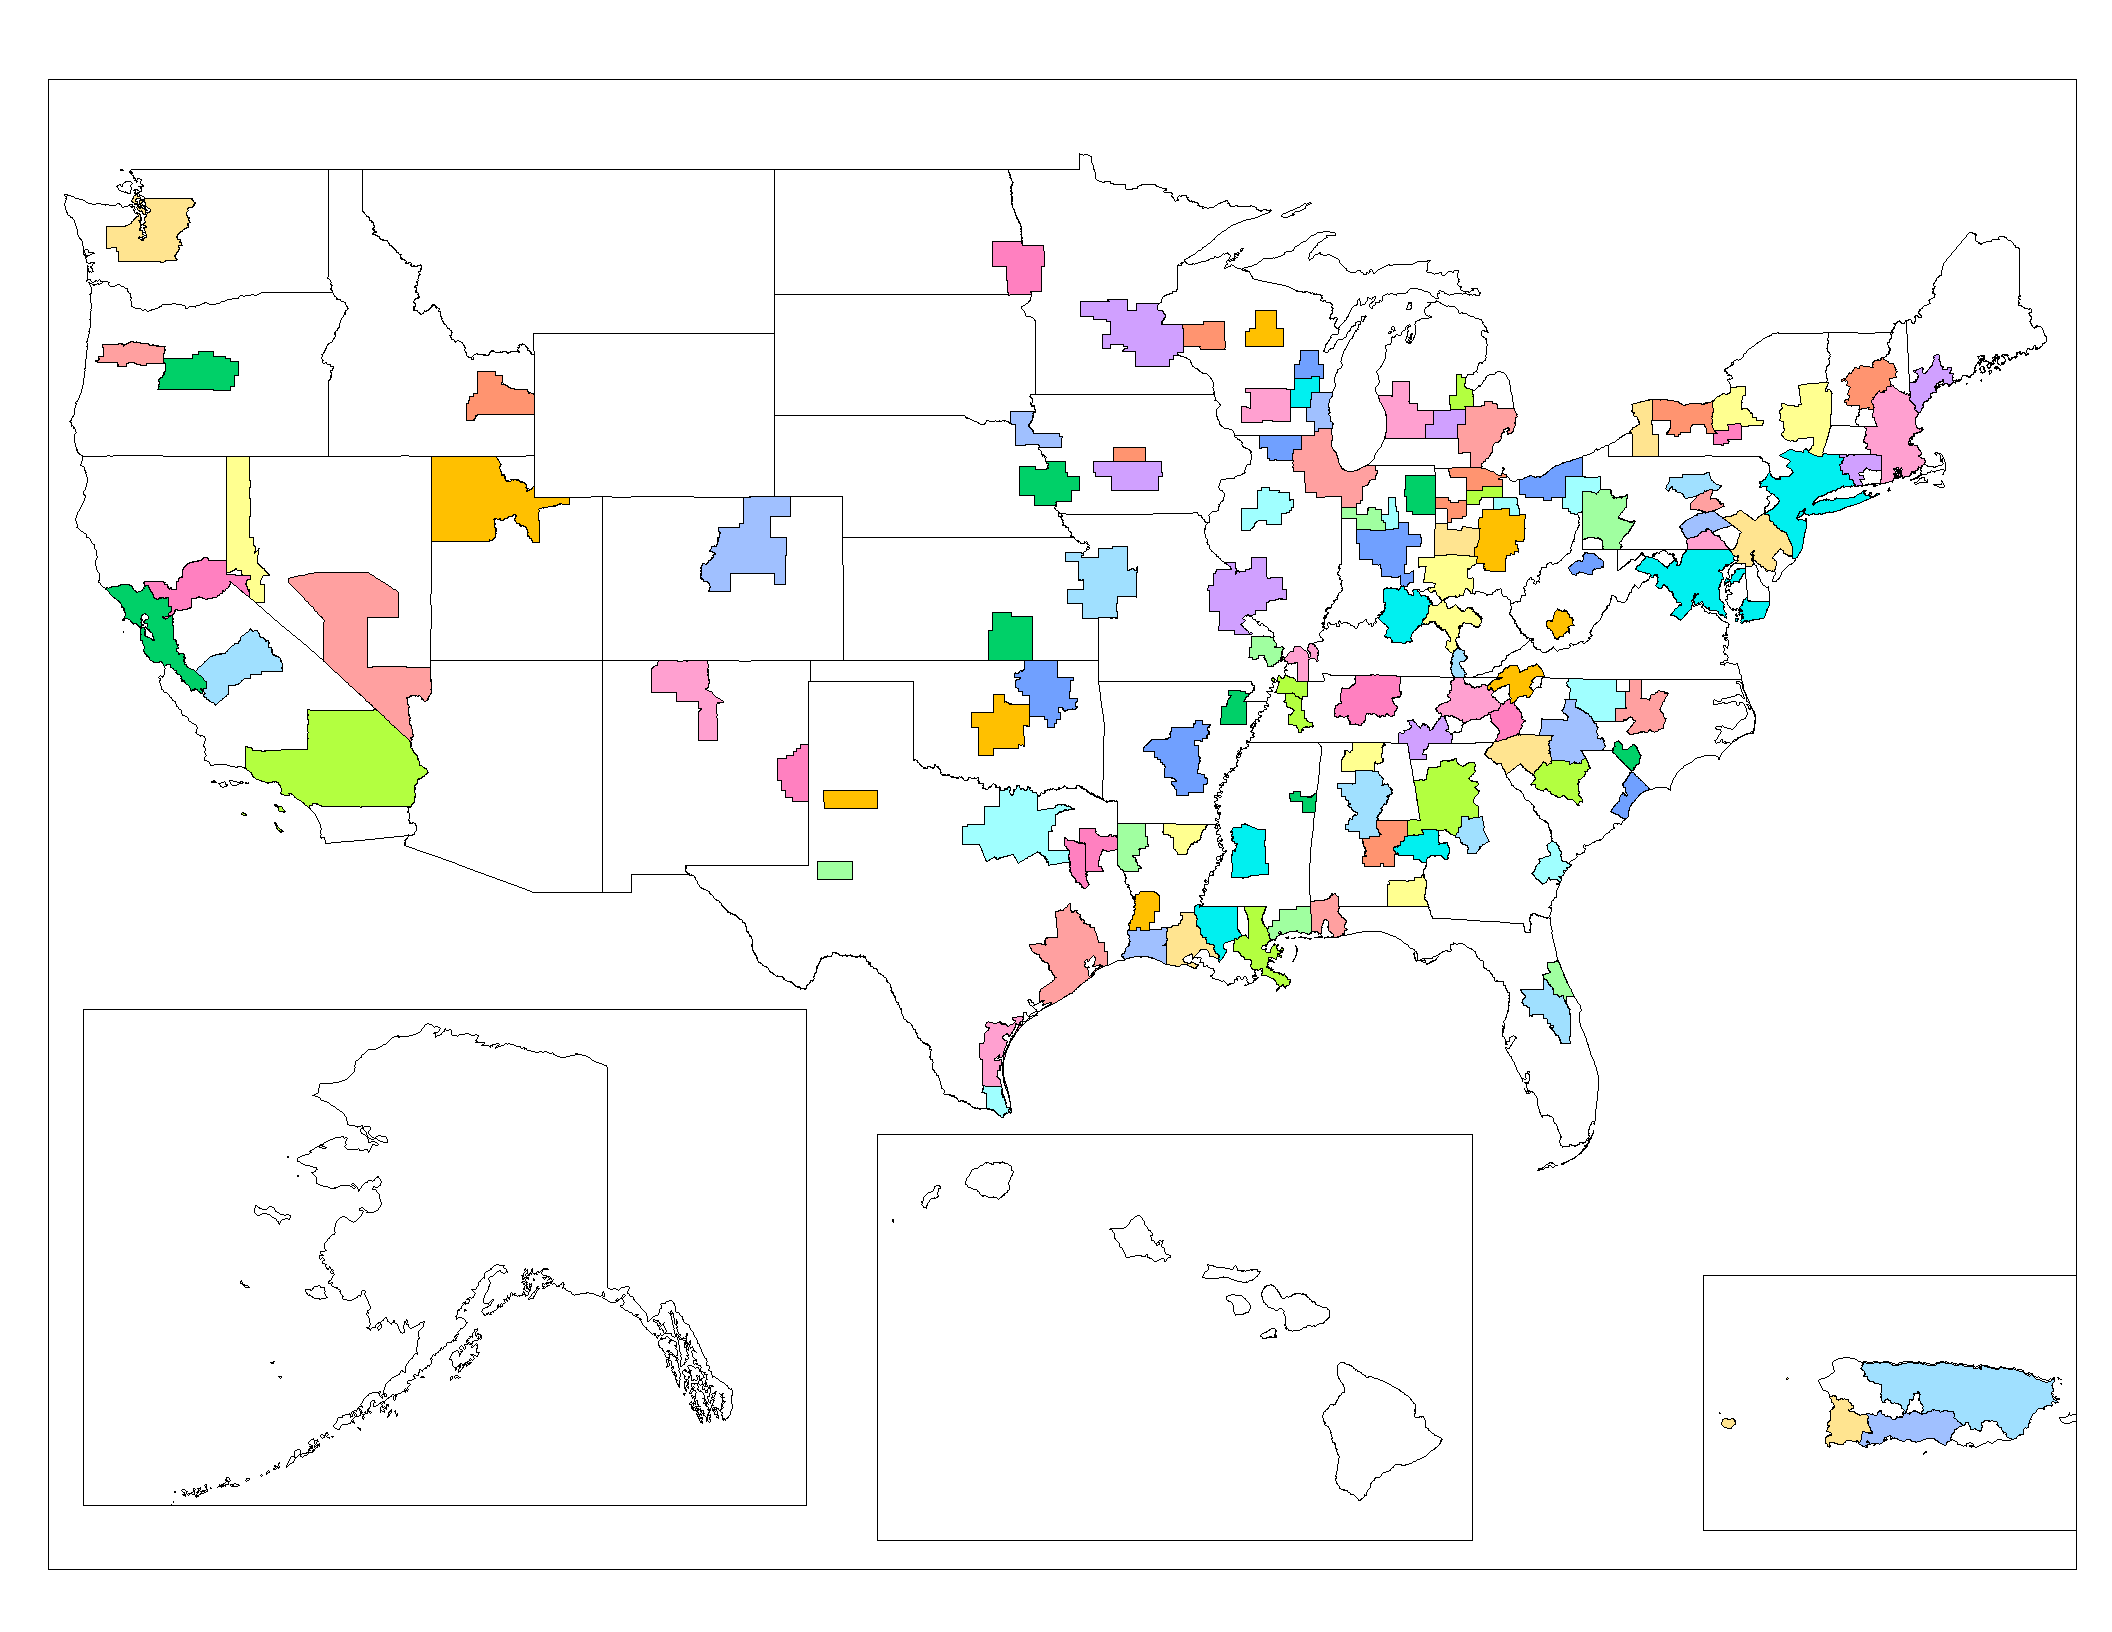
An enlargeable map of the 125 Combined Statistical Areas (CSAs) of the United States
The United States Office of Management and Budget (OMB) has defined 125 Combined Statistical Areas (CSAs)[1] for the United States of America. The OMB defines a Combined Statistical Area as an aggregate of adjacent Core Based Statistical Areas (CBSAs)[2] that are linked by commuting ties.[3]
The Combined Statistical Area is the most extensive of the metropolitan area concepts defined by the OMB. The population of a Combined Statistical Area is greater than any of its (often similarly named) constituent Core Based Statistical Areas. Many metropolitan areas such as Miami, Phoenix, San Diego, Tampa, Portland, Jacksonville, San Antonio, and Virginia Beach have only a single urban core, and thus have no associated CSA. In addition, the U.S. Census Bureau only considers the U.S. resident population of metropolitan areas such as San Diego, El Paso, Detroit, and Buffalo. The bureau does not count people living near the United States, but not actually in the country, such as Canadians living near Detroit or Buffalo, or Mexicans living near El Paso or San Diego.
Table[]
The following sortable table lists the 125 Combined Statistical Areas (CSAs) of the United States with the following information:
- The CSA rank by population as of July 1, 2010, as counted by the United States Census Bureau[4]
- The CSA name as defined by the United States Office of Management and Budget[3]
- The CSA population as of April 1, 2000, as counted by the United States Census 2000[5]
- The Core Based Statistical Areas (CBSAs) that constitute the CSA[3]
Please note: The Office of Management and Budget defines a Combined Statistical Area only if two or more adjacent Core Based Statistical Areas have substantial commuting ties.
- See the Table of United States Core Based Statistical Areas for a comprehensive list of the single-core Metropolitan Statistical Areas and Micropolitan Statistical Areas of the United States.
- See the Table of United States primary census statistical areas for an overview of the single-core and multi-core metropolitan areas of the United States.
| Rank | Combined Statistical Area | 2010 Pop | 2000 Pop | Change | Core Based Statistical Areas |
|---|---|---|---|---|---|
| 1 | New York-Newark-Bridgeport, NY-NJ-CT-PA CSA | 22,085,649 | 21,361,797 | +3.39% | New York-Northern New Jersey-Long Island, NY-NJ-PA MSA Bridgeport-Stamford-Norwalk, CT MSA New Haven-Milford, CT MSA Poughkeepsie-Newburgh-Middletown, NY MSA Trenton-Ewing, NJ MSA Torrington, CT µSA Kingston, NY MSA |
| 2 | Los Angeles-Long Beach-Riverside, CA CSA | 17,877,006 | 16,373,645 | +9.18% | Los Angeles-Long Beach-Santa Ana, CA MSA Riverside-San Bernardino-Ontario, CA MSA Oxnard-Thousand Oaks-Ventura, CA MSA |
| 3 | Chicago-Naperville-Michigan City, IL-IN-WI CSA | 9,686,021 | 9,312,255 | +4.01% | Chicago-Naperville-Joliet, IL-IN-WI MSA Kankakee-Bradley, IL MSA Michigan City-La Porte, IN MSA |
| 4 | Washington-Baltimore-Northern Virginia, DC-MD-VA-WV CSA | 8,572,971 | 7,572,647 | +13.21% | Washington-Arlington-Alexandria, DC-VA-MD-WV MSA Baltimore-Towson, MD MSA Winchester, VA-WV MSA Lexington Park, MD µSA Culpeper, VA µSA |
| 5 | Boston-Worcester-Manchester, MA-RI-NH CSA | 7,559,060 | 7,298,695 | +3.57% | Boston-Cambridge-Quincy, MA-NH MSA Providence-New Bedford-Fall River, RI-MA MSA Worcester, MA MSA Manchester-Nashua, NH MSA Concord, NH µSA Laconia, NH µSA |
| 6 | San Jose-San Francisco-Oakland, CA CSA | 7,468,390 | 7,092,596 | +5.30% | San Francisco-Oakland-Fremont, CA MSA San Jose-Sunnyvale-Santa Clara, CA MSA Santa Rosa-Petaluma, CA MSA Vallejo-Fairfield, CA MSA Santa Cruz-Watsonville, CA MSA Napa, CA MSA |
| 7 | Dallas-Fort Worth, TX CSA | 6,731,317 | 5,487,956 | +22.66% | Dallas-Fort Worth-Arlington, TX MSA Sherman-Denison, TX MSA Athens, TX µSA Granbury, TX µSA Gainesville, TX µSA Bonham, TX µSA Mineral Wells, TX µSA |
| 8 | Philadelphia-Camden-Vineland, PA-NJ-DE-MD CSA | 6,533,683 | 6,207,223 | +5.26% | Philadelphia-Camden-Wilmington, PA-NJ-DE-MD MSA Reading, PA MSA Vineland-Millville-Bridgeton, NJ MSA |
| 9 | Houston-Baytown-Huntsville, TX CSA | 6,051,363 | 4,815,122 | +25.67% | Houston-Sugar Land-Baytown, TX MSA Huntsville, TX µSA Bay City, TX µSA |
| 10 | Atlanta-Sandy Springs-Gainesville, GA-AL CSA | 5,618,431 | 4,548,344 | +23.53% | Atlanta-Sandy Springs-Marietta, GA MSA Gainesville, GA MSA LaGrange, GA µSA Cedartown, GA µSA Valley, AL µSA Thomaston, GA µSA |
| 11 | Detroit-Warren-Flint, MI CSA | 5,218,852 | 5,357,538 | −2.59% | Detroit-Warren-Livonia, MI MSA Flint, MI MSA Ann Arbor, MI MSA Monroe, MI MSA |
| 12 | Seattle-Tacoma-Olympia, WA CSA | 4,199,312 | 3,707,144 | +13.28% | Seattle-Tacoma-Bellevue, WA MSA Olympia, WA MSA Bremerton-Silverdale, WA MSA Mount Vernon-Anacortes, WA MSA Oak Harbor, WA µSA Shelton, WA µSA |
| 13 | Minneapolis-St. Paul-St. Cloud, MN-WI CSA | 3,615,902 | 3,271,888 | +10.51% | Minneapolis-St. Paul-Bloomington, MN-WI MSA St. Cloud, MN MSA Faribault-Northfield, MN µSA Red Wing, MN µSA Hutchinson, MN µSA |
| 14 | Denver-Aurora-Boulder, CO CSA | 3,090,874 | 2,629,980 | +17.52% | Denver-Aurora-Broomfield, CO MSA Boulder, CO MSA Greeley, CO MSA |
| 15 | Cleveland-Akron-Elyria, OH CSA | 2,881,937 | 2,945,831 | −2.17% | Cleveland-Elyria-Mentor, OH MSA Akron, OH MSA Ashtabula, OH µSA |
| 16 | St. Louis-St. Charles-Farmington, MO-IL CSA | 2,878,255 | 2,754,328 | +4.50% | St. Louis, MO-IL MSA Farmington, MO µSA |
| 17 | Orlando-Deltona-Daytona Beach, FL CSA | 2,818,120 | 2,191,081 | +28.62% | Orlando-Kissimmee-Sanford, FL MSA Deltona-Daytona Beach-Ormond Beach, FL MSA Palm Coast, FL MSA The Villages, FL µSA |
| 18 | Sacramento–Arden Arcade–Yuba City, CA-NV CSA | 2,461,780 | 2,069,298 | +18.97% | Sacramento–Arden Arcade–Roseville, CA MSA Yuba City, CA MSA Truckee-Grass Valley, CA µSA Gardnerville Ranchos, NV µSA |
| 19 | Pittsburgh-New Castle, PA CSA | 2,447,393 | 2,525,730 | −3.10% | Pittsburgh, PA MSA New Castle, PA µSA |
| 20 | Charlotte-Gastonia-Salisbury, NC-SC CSA | 2,402,623 | 1,897,034 | +26.65% | Charlotte-Gastonia-Concord, NC-SC MSA Statesville-Mooresville, NC µSA Salisbury, NC µSA Shelby, NC µSA Lancaster, SC µSA Lincolnton, NC µSA Albemarle, NC µSA Chester, SC µSA |
| 21 | Cincinnati-Middletown-Wilmington, OH-KY-IN CSA | 2,172,191 | 2,050,175 | +5.95% | Cincinnati-Middletown, OH-KY-IN MSA Wilmington, OH µSA |
| 22 | Kansas City-Overland Park-Kansas City, MO-KS CSA | 2,104,853 | 1,901,070 | +10.72% | Kansas City, MO-KS MSA Warrensburg, MO µSA Atchison, KS µSA |
| 23 | Indianapolis-Anderson-Columbus, IN CSA | 2,080,782 | 1,843,588 | +12.87% | Indianapolis-Carmel, IN MSA Anderson, IN MSA Columbus, IN MSA New Castle, IN µSA Crawfordsville, IN µSA North Vernon, IN µSA |
| 24 | Columbus-Marion-Chillicothe, OH CSA | 2,071,052 | 1,835,189 | +12.85% | Columbus, OH MSA Chillicothe, OH µSA Marion, OH µSA Mount Vernon, OH µSA Washington Court House, OH µSA |
| 25 | Las Vegas-Paradise-Pahrump, NV CSA | 1,995,215 | 1,408,250 | +41.68% | Las Vegas-Paradise, NV MSA Pahrump, NV µSA |
| 26 | Austin-Round Rock-Marble Falls, TX CSA | 1,759,039 | 1,283,910 | +37.01% | Austin-Round Rock-San Marcos, TX MSA Marble Falls, TX µSA |
| 27 | Milwaukee-Racine-Waukesha, WI CSA | 1,751,316 | 1,689,572 | +3.65% | Milwaukee-Waukesha-West Allis, WI MSA Racine, WI MSA |
| 28 | Raleigh-Durham-Cary, NC CSA | 1,749,525 | 1,314,589 | +33.09% | Raleigh-Cary, NC MSA Durham-Chapel Hill, NC MSA Dunn, NC µSA |
| 29 | Salt Lake City-Ogden-Clearfield, UT CSA | 1,744,886 | 1,469,474 | +18.74% | Salt Lake City, UT MSA Ogden-Clearfield, UT MSA Brigham City, UT µSA Heber, UT µSA |
| 30 | Nashville-Davidson–Murfreesboro–Columbia, TN CSA | 1,670,890 | 1,381,287 | +20.97% | Nashville-Davidson–Murfreesboro–Franklin, TN MSA Columbia, TN µSA |
| 31 | Greensboro–Winston-Salem–High Point, NC CSA | 1,589,200 | 1,414,656 | +12.34% | Greensboro-High Point, NC MSA Winston-Salem, NC MSA Thomasville-Lexington, NC µSA Burlington, NC MSA Mount Airy, NC µSA |
| 32 | Louisville/Jefferson County–Elizabethtown–Scottsburg, KY-IN CSA | 1,427,483 | 1,292,482 | +10.45% | Louisville/Jefferson County, KY-IN MSA Elizabethtown, KY MSA Scottsburg, IN µSA |
| 33 | Hartford-West Hartford-Willimantic, CT CSA | 1,330,809 | 1,257,709 | +5.81% | Hartford-West Hartford-East Hartford, CT MSA Willimantic, CT µSA |
| 34 | Oklahoma City-Shawnee, OK CSA | 1,322,429 | 1,160,942 | +13.91% | Oklahoma City, OK MSA Shawnee, OK µSA |
| 35 | Grand Rapids-Muskegon-Holland, MI CSA | 1,321,557 | 1,254,661 | +5.33% | Grand Rapids-Wyoming, MI MSA Holland-Grand Haven, MI MSA Muskegon-Norton Shores, MI MSA Allegan, MI µSA |
| 36 | Greenville-Spartanburg-Anderson, SC CSA | 1,266,995 | 1,128,104 | +12.31% | Greenville-Mauldin-Easley, SC MSA Spartanburg, SC MSA Anderson, SC MSA Seneca, SC µSA Gaffney, SC µSA Union, SC µSA |
| 37 | Buffalo-Niagara-Cattaraugus, NY CSA | 1,215,826 | 1,254,066 | −3.05% | Buffalo-Niagara Falls, NY MSA Olean, NY µSA |
| 38 | New Orleans-Metairie-Bogalusa, LA CSA | 1,214,932 | 1,360,436 | −10.70% | New Orleans-Metairie-Kenner, LA MSA Bogalusa, LA µSA |
| 39 | Birmingham-Hoover-Cullman, AL CSA | 1,208,453 | 1,129,721 | +6.97% | Birmingham-Hoover, AL MSA Cullman, AL µSA |
| 40 | Albany-Schenectady-Amsterdam, NY CSA | 1,168,485 | 1,118,095 | +4.51% | Albany-Schenectady-Troy, NY MSA Glens Falls, NY MSA Hudson, NY µSA Gloversville, NY µSA Amsterdam, NY µSA |
| 41 | Rochester-Batavia-Seneca Falls, NY CSA | 1,149,653 | 1,131,543 | +1.60% | Rochester, NY MSA Batavia, NY µSA Seneca Falls, NY µSA |
| 42 | Fresno-Madera, CA CSA | 1,081,315 | 922,516 | +17.21% | Fresno, CA MSA Madera-Chowchilla, CA MSA |
| 43 | Dayton-Springfield-Greenville, OH CSA | 1,072,891 | 1,085,094 | −1.12% | Dayton, OH MSA Springfield, OH MSA Greenville, OH µSA Urbana, OH µSA |
| 44 | Knoxville-Sevierville-La Follette, TN CSA | 1,055,086 | 935,659 | +12.76% | Knoxville, TN MSA Morristown, TN MSA Sevierville, TN µSA Harriman, TN µSA La Follette, TN µSA Newport, TN µSA |
| 45 | Tulsa-Bartlesville, OK CSA | 988,454 | 908,528 | +8.80% | Tulsa, OK MSA Bartlesville, OK µSA |
| 46 | Omaha-Council Bluffs-Fremont, NE-IA CSA | 902,041 | 803,201 | +12.31% | Omaha-Council Bluffs, NE-IA MSA Fremont, NE µSA |
| 47 | Little Rock-North Little Rock-Pine Bluff, AR CSA | 877,091 | 785,024 | +11.73% | Little Rock-North Little Rock-Conway, AR MSA Pine Bluff, AR MSA Searcy, AR µSA |
| 48 | Sarasota-Bradenton-Punta Gorda, FL CSA | 862,259 | 731,586 | +17.86% | Bradenton-Sarasota-Venice, FL MSA Punta Gorda, FL MSA |
| 49 | Baton Rouge-Pierre Part, LA CSA | 825,905 | 729,361 | +13.24% | Baton Rouge, LA MSA Pierre Part, LA µSA |
| 50 | Columbia-Newberry, SC CSA | 805,106 | 683,266 | +17.83% | Columbia, SC MSA Newberry, SC µSA |
| 51 | Syracuse-Auburn, NY CSA | 742,603 | 732,117 | +1.43% | Syracuse, NY MSA Auburn, NY µSA |
| 52 | Toledo-Fremont, OH CSA | 712,373 | 720,980 | −1.19% | Toledo, OH MSA Fremont, OH µSA |
| 53 | Chattanooga-Cleveland-Athens, TN-GA CSA | 696,197 | 629,561 | +10.58% | Chattanooga, TN-GA MSA Cleveland, TN MSA Athens, TN µSA |
| 54 | Lexington-Fayette–Frankfort–Richmond, KY CSA | 687,173 | 602,773 | +14.00% | Lexington-Fayette, KY MSA Richmond-Berea, KY µSA Frankfort, KY µSA Mount Sterling, KY µSA |
| 55 | Harrisburg-Carlisle-Lebanon, PA CSA | 683,043 | 629,401 | +8.52% | Harrisburg-Carlisle, PA MSA Lebanon, PA MSA |
| 56 | Youngstown-Warren-East Liverpool, OH-PA CSA | 673,614 | 715,039 | −5.79% | Youngstown-Warren-Boardman, OH-PA MSA East Liverpool-Salem, OH µSA |
| 57 | Wichita-Winfield, KS CSA | 659,372 | 607,457 | +8.55% | Wichita, KS MSA Winfield, KS µSA |
| 58 | Des Moines-Newton-Pella, IA CSA | 639,784 | 550,659 | +16.19% | Des Moines-West Des Moines, IA MSA Newton, IA µSA Pella, IA µSA |
| 59 | Madison-Baraboo, WI CSA | 630,569 | 556,999 | +13.21% | Madison, WI MSA Baraboo, WI µSA |
| 60 | Portland-Lewiston-South Portland, ME CSA | 621,800 | 591,361 | +5.15% | Portland-South Portland-Biddeford, ME MSA Lewiston-Auburn, ME MSA |
| 61 | Fort Wayne-Huntington-Auburn, IN CSA | 611,712 | 581,630 | +5.17% | Fort Wayne, IN MSA Kendallville, IN µSA Auburn, IN µSA Huntington, IN µSA Decatur, IN µSA Angola, IN µSA |
| 62 | Mobile-Daphne-Fairhope, AL CSA | 595,257 | 540,258 | +10.18% | Mobile, AL MSA Daphne-Fairhope-Foley, AL µSA |
| 63 | Huntsville-Decatur, AL CSA | 571,422 | 488,243 | +17.04% | Huntsville, AL MSA Decatur, AL MSA |
| 64 | Jackson-Yazoo City, MS CSA | 567,122 | 525,346 | +7.95% | Jackson, MS MSA Yazoo City, MS µSA |
| 65 | South Bend-Elkhart-Mishawaka, IN-MI CSA | 563,834 | 544,582 | +3.54% | South Bend-Mishawaka, IN-MI MSA Elkhart-Goshen, IN MSA Plymouth, IN µSA |
| 66 | Port St. Lucie-Sebastian-Vero Beach, FL CSA | 562,135 | 432,373 | +30.01% | Port St. Lucie, FL MSA Sebastian-Vero Beach, FL MSA |
| 67 | Lafayette-Acadiana, LA CSA | 550,134 | 512,720 | +7.30% | Lafayette, LA MSA Opelousas-Eunice, LA µSA New Iberia, LA µSA Crowley, LA µSA Abbeville, LA µSA |
| 68 | York-Hanover-Gettysburg, PA CSA | 536,379 | 473,043 | +13.39% | York-Hanover, PA MSA Gettysburg, PA µSA |
| 69 | Lansing-East Lansing-Owosso, MI CSA | 534,684 | 519,415 | +2.94% | Lansing-East Lansing, MI MSA Owosso, MI µSA |
| 70 | Johnson City-Kingsport-Bristol (Tri-Cities), TN-VA CSA | 508,260 | 480,091 | +5.87% | Kingsport-Bristol-Bristol, TN-VA MSA Johnson City, TN MSA |
| 71 | Reno-Sparks-Fernley, NV CSA | 477,397 | 377,386 | +26.50% | Reno-Sparks, NV MSA Fernley, NV µSA |
| 72 | Corpus Christi-Kingsville, TX CSA | 460,662 | 435,243 | +5.84% | Corpus Christi, TX MSA Kingsville, TX µSA |
| 73 | Asheville-Brevard, NC CSA | 457,948 | 398,505 | +14.92% | Asheville, NC MSA Brevard, NC µSA |
| 74 | Columbus-Auburn-Opelika, GA-AL CSA | 456,564 | 420,965 | +8.46% | Columbus, GA-AL MSA Auburn-Opelika, AL MSA Tuskegee, AL µSA |
| 75 | Rockford-Freeport-Rochelle, IL CSA | 450,639 | 420,215 | +7.24% | Rockford, IL MSA Rochelle, IL µSA Freeport, IL µSA |
| 76 | Shreveport-Bossier City-Minden, LA CSA | 439,811 | 417,796 | +5.27% | Shreveport-Bossier City, LA MSA Minden, LA µSA |
| 77 | Brownsville-Harlingen-Raymondville, TX CSA | 428,354 | 355,309 | +20.56% | Brownsville-Harlingen, TX MSA Raymondville, TX µSA |
| 78 | Montgomery-Alexander City, AL CSA | 427,691 | 400,205 | +6.87% | Montgomery, AL MSA Alexander City, AL µSA |
| 79 | Savannah-Hinesville-Fort Stewart, GA CSA | 425,528 | 364,914 | +16.61% | Savannah, GA MSA Hinesville-Fort Stewart, GA MSA |
| 80 | Peoria-Canton, IL CSA | 416,255 | 405,149 | +2.74% | Peoria, IL MSA Canton, IL µSA |
| 81 | Gulfport-Biloxi-Pascagoula, MS CSA | 411,066 | 396,754 | +3.61% | Gulfport-Biloxi, MS MSA Pascagoula, MS MSA |
| 82 | Macon-Warner Robins-Fort Valley, GA CSA | 399,888 | 356,801 | +12.08% | Macon, GA MSA Warner Robins, GA MSA Fort Valley, GA µSA |
| 83 | Appleton-Oshkosh-Neenah, WI CSA | 392,660 | 358,365 | +9.57% | Appleton, WI MSA Oshkosh-Neenah, WI MSA |
| 84 | Myrtle Beach-Conway-Georgetown, SC CSA | 329,449 | 252,426 | +30.51% | Myrtle Beach-North Myrtle Beach-Conway, SC MSA Georgetown, SC µSA |
| 85 | Saginaw-Bay City-Saginaw Township North, MI CSA | 307,940 | 320,196 | −3.83% | Saginaw-Saginaw Township North, MI MSA Bay City, MI MSA |
| 86 | Lubbock-Levelland, TX CSA | 307,825 | 272,416 | +13.00% | Lubbock, TX MSA Levelland, TX µSA |
| 87 | Longview-Marshall, TX CSA | 280,000 | 256,152 | +9.31% | Longview, TX MSA Marshall, TX µSA |
| 88 | Midland-Odessa, TX CSA | 274,002 | 237,132 | +15.55% | Odessa, TX MSA Midland, TX MSA |
| 89 | Tyler-Jacksonville, TX CSA | 260,559 | 221,365 | +17.71% | Tyler, TX MSA Jacksonville, TX µSA |
| 90 | Dothan-Enterprise-Ozark, AL CSA | 245,838 | 223,605 | +9.94% | Dothan, AL MSA Enterprise-Ozark, AL µSA |
| 91 | Lafayette-Frankfort, IN CSA | 235,013 | 212,407 | +10.64% | Lafayette, IN MSA Frankfort, IN µSA |
| 92 | Fargo-Wahpeton, ND-MN CSA | 231,674 | 199,503 | +16.13% | Fargo, ND-MN MSA Wahpeton, ND-MN µSA |
| 93 | Lake Charles-Jennings, LA CSA | 231,201 | 225,003 | +2.75% | Lake Charles, LA MSA Jennings, LA µSA |
| 94 | Claremont-Lebanon, NH-VT CSA | 218,466 | 207,845 | +5.11% | Lebanon, NH-VT µSA Claremont, NH µSA |
| 95 | Eau Claire-Menomonie, WI CSA | 205,008 | 188,195 | +8.93% | Eau Claire, WI MSA Menomonie, WI µSA |
| 96 | Monroe-Bastrop, LA CSA | 204,420 | 201,074 | +1.66% | Monroe, LA MSA Bastrop, LA µSA |
| 97 | Albany-Corvallis-Lebanon, OR CSA | 202,251 | 181,222 | +11.60% | Albany-Lebanon, OR µSA Corvallis, OR MSA |
| 98 | Fond du Lac-Beaver Dam, WI CSA | 190,392 | 183,193 | +3.93% | Fond du Lac, WI MSA Beaver Dam, WI µSA |
| 99 | Santa Fe-Espanola, NM CSA | 184,416 | 170,482 | +8.17% | Santa Fe, NM MSA Espanola, NM µSA |
| 100 | Lima-Van Wert-Wapakoneta, OH CSA | 181,024 | 184,743 | −2.01% | Lima, OH MSA Wapakoneta, OH µSA Van Wert, OH µSA |
| 101 | Sunbury-Lewisburg-Selinsgrove, PA CSA | 179,177 | 173,726 | +3.14% | Sunbury, PA µSA Lewisburg, PA µSA Selinsgrove, PA µSA |
| 102 | Bend-Prineville, OR CSA | 178,711 | 134,549 | +32.82% | Bend, OR MSA Prineville, OR µSA |
| 103 | Salisbury-Ocean Pines, MD CSA | 176,657 | 155,934 | +13.29% | Salisbury, MD MSA Ocean Pines, MD µSA |
| 104 | Idaho Falls-Blackfoot, ID CSA | 175,981 | 143,412 | +22.71% | Idaho Falls, ID MSA Blackfoot, ID µSA |
| 105 | Lumberton-Laurinburg, NC CSA | 170,325 | 159,337 | +6.90% | Lumberton, NC µSA Laurinburg, NC µSA |
| 106 | Mansfield-Bucyrus, OH CSA | 168,259 | 175,818 | −4.30% | Mansfield, OH MSA Bucyrus, OH µSA |
| 107 | Jackson-Humboldt, TN CSA | 165,108 | 155,529 | +6.16% | Jackson, TN MSA Humboldt, TN µSA |
| 108 | Jonesboro-Paragould, AR CSA | 163,116 | 145,093 | +12.42% | Jonesboro, AR MSA Paragould, AR µSA |
| 109 | Wausau-Merrill, WI CSA | 162,806 | 155,475 | +4.72% | Wausau, WI MSA Merrill, WI µSA |
| 110 | Sioux City-Vermillion, IA-NE-SD CSA | 157,441 | 156,590 | +0.54% | Sioux City, IA-NE-SD MSA Vermillion, SD µSA |
| 111 | Williamsport-Lock Haven, PA CSA | 155,349 | 157,958 | −1.65% | Williamsport, PA MSA Lock Haven, PA µSA |
| 112 | Ithaca-Cortland, NY CSA | 150,900 | 145,100 | +4.00% | Ithaca, NY MSA Cortland, NY µSA |
| 113 | Fairmont-Clarksburg, WV CSA | 150,614 | 148,742 | +1.26% | Clarksburg, WV µSA Fairmont, WV µSA |
| 114 | Paducah-Mayfield, KY-IL CSA | 135,883 | 135,793 | +0.07% | Paducah, KY-IL µSA Mayfield, KY µSA |
| 115 | Kokomo-Peru, IN CSA | 135,591 | 137,623 | −1.48% | Kokomo, IN MSA Peru, IN µSA |
| 116 | Cape Girardeau-Sikeston-Jackson, MO-IL CSA | 135,466 | 130,734 | +3.62% | Cape Girardeau-Jackson, MO-IL MSA Sikeston, MO µSA |
| 117 | Findlay-Tiffin, OH CSA | 131,527 | 129,978 | +1.19% | Findlay, OH µSA Tiffin, OH µSA |
| 118 | Carbondale-Marion-Herrin, IL CSA | 126,575 | 120,908 | +4.69% | Marion-Herrin, IL µSA Carbondale, IL µSA |
| 119 | Beckley-Oak Hill, WV CSA | 124,898 | 126,799 | −1.50% | Beckley, WV µSA Oak Hill, WV µSA |
| 120 | Ames-Boone, IA CSA | 115,848 | 106,205 | +9.08% | Ames, IA MSA Boone, IA µSA |
| 121 | Corbin-London, KY CSA | 94,486 | 88,580 | +6.67% | London, KY µSA Corbin, KY µSA |
| 122 | Fort Polk South-De Ridder, LA CSA | 87,988 | 85,517 | +2.89% | Fort Polk South, LA µSA De Ridder, LA µSA |
| 123 | Columbus-West Point, MS CSA | 80,413 | 83,565 | −3.77% | Columbus, MS µSA West Point, MS µSA |
| 124 | Union City-Martin, TN-KY CSA | 73,641 | 75,097 | −1.94% | Union City, TN-KY µSA Martin, TN µSA |
| 125 | Clovis-Portales, NM CSA | 68,222 | 63,062 | +8.18% | Clovis, NM µSA Portales, NM µSA |
See also[]
- Geography
- Human geography
- Demography
- Human geography
- United States
- United States Census Bureau
- United States Office of Management and Budget
- Combined Statistical Area
- Core Based Statistical Area
- United States urban area
- Demographics of the United States
- Table of United States Combined Statistical Areas (CSA)
- Table of United States Core Based Statistical Areas (CBSA)
- Table of United States primary census statistical areas (PCSA)
- List of United States urban areas
References[]
- ^ The United States Office of Management and Budget (OMB) defines a Combined Statistical Area (CSA) as an aggregate of adjacent Core Based Statistical Areas that are linked by commuting ties. The OMB has defined 125 CSAs for the United States as of March 29, 2010.
- ^ The United States Office of Management and Budget (OMB) defines a Core Based Statistical Area as one or more adjacent counties or county equivalents that have at least one urban core area of at least 10,000 population, together with adjacent communities having a high degree of economic and social integration with that core. As of March 29, 2010, the OMB has defined 942 Core Based Statistical Areas (CBSAs) for the United States comprising 366 Metropolitan Statistical Areas (MSAs), which have an urban core population of 50,000 or more, and 576 Micropolitan Statistical Areas (μSAs), which have an urban core population of 10,000 or more but less than 50,000.
- ^ a b c "OMB Bulletin No. 10-02: Update of Statistical Area Definitions and Guidance on Their Uses". United States Office of Management and Budget. December 1, 2009. http://www.whitehouse.gov/omb/assets/bulletins/b10-02.pdf. Retrieved March 29, 2010.
- ^ "Population and Housing Occupancy Status: 2010 - United States -- Combined Statistical Area; and for Puerto Rico". United States Census Bureau. 2010. http://factfinder2.census.gov/faces/tableservices/jsf/pages/productview.xhtml?pid=DEC_10_NSRD_GCTPL2.US41PR&prodType=table. Retrieved 2011-04-23.
- ^ "Annual Estimates of the Population of Combined Statistical Areas: April 1, 2000 to July 1, 2009" (CSV). 2009 Population Estimates. United States Census Bureau, Population Division. March 23, 2010. http://www.census.gov/popest/metro/files/2009/CSA-EST2009-alldata.csv. Retrieved March 29, 2010.
External links[]
| |||||||

| This page uses content from the English language Wikipedia. The original content was at Table of United States Combined Statistical Areas. The list of authors can be seen in the page history. As with this Familypedia wiki, the content of Wikipedia is available under the Creative Commons License. |